Juniper ScreenOS – Troubleshooting using Debug Flow
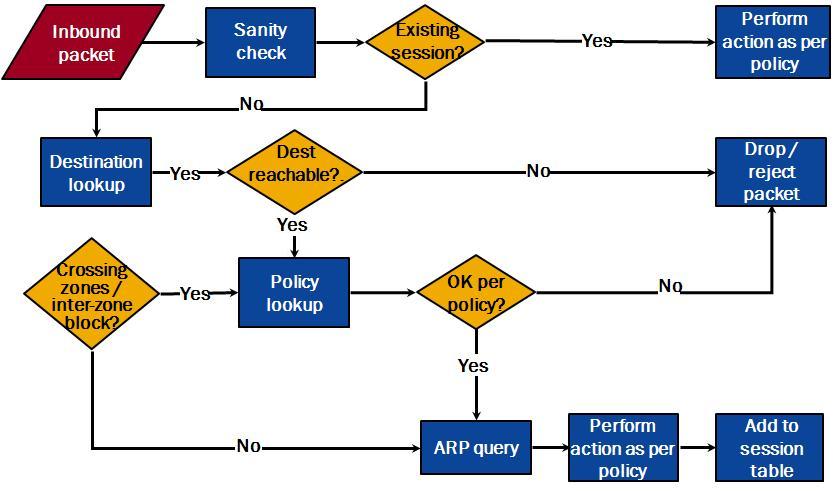
Debug flow basic
shows the flow of traffic through the firewall, allowing for troubleshooting route selection, policy selection, any address translation and whether the packet is received or dropped by the firewall.
Debug ike detail
show all of the vpn messages between two devices when setting up the vpn. Useful to see problems between Juniper and 3rd party firewalls or configuration problems.
- Other debugs are ones allowing troubleshooting of routing protocols, av, deep inspection, higher availability, NAT and loads of others. You can find out what others there are by typing ‘debug ?’ on the cli.
- Debug captures are sent to a buffer by default but can be sent the console.
Buffer commands:
get dbuf info – Displays debug buffer size in bytes
get dbuf stream – Displays the contents of the debug buffer
set dbuf size – Allocates system memory for the debug buffer
clear dbuf – Clears the contents of the debug buffer
Best Practices – debug flow basic and how to read the output
Debug Flow basic
1) get ffilter – see if an filters have been set already, if they have you use ‘unset ffilter’ to remove
2) set ffilter – allows you to limit the traffic that you capture using src-ip, src-port, dst-ip, dst-port, ip-proto Recommeded as debug flow basic can be intensive on the firewall especially if it is under heavy load.
– Filters that are written on one line are and ‘AND’ statement. eg set ffilter scr-ip 10.1.1.1 dst-ip 2.2.2.2 will match 10.1.1.1 AND 2.2.2.2
– Filters that are on seperate lines are ‘OR’ statements. eg set ffilter scr-ip 10.1.1.1, set ffilter dst-ip 2.2.2.2 will match 10.1.1.1 OR 2.2.2.2
3) debug flow basic – turns on flow debuging with a level of basic logging
4) clear db – make sure there is nothing in the debug buffer from previous debugs
5) Begin the test, do a ping or try to access the resource that you are having problems with.
6) undebug all (or press Esc key – turns off debug)
7) get db str – reads the debug buffer and outputs it to the screen for reading.
8) unset ffilter – remove ffilters when finished
Reading a Debug Flow Basic
FW-> get dbuf stream
****** 15625.0: <private/ethernet0/5> packet received [60]****** – This is the interface and zone that the packet arrives on
ipid = 34344(8628), @02cdf8b0
packet passed sanity check.
ethernet0/5:10.1.1.5/17152->1.1.70.250/256,1(8/0)<Root> – This is the packet IP info ports and protocol
no session found – Looks for existing sessions on the firewall
flow_first_sanity_check: in <ethernet0/5>, out <N/A>
chose interface ethernet0/5 as incoming nat if. – There is NAT on the interface
flow_first_routing: in <ethernet0/5>, out <N/A>
search route to (ethernet0/5, 10.1.1.5->1.1.70.250) in vr trust-vr for vsd-0/flag-0/ifp-null
[ Dest] 10.route 1.1.70.250->0.0.0.0, to ethernet0/6 – matches route 10 in the trust-vr routing table
routed (x_dst_ip 1.1.70.250) from ethernet0/5 (ethernet0/5 in 0) to ethernet0/6
policy search from zone 104-> zone 103 – Tells you which policy set its going to look at zone to zone derived from routing
policy_flow_search policy search nat_crt from zone 104-> zone 103
RPC Mapping Table search returned 0 matched service(s) for (vsys Root, ip 1.1.70.250, port 2396, proto 1)
No SW RPC rule match, search HW rule
Permitted by policy 2 – Tells you which policy the traffic has hit and what the action is
No src xlate choose interface ethernet0/6 as outgoing phy if
no loop on ifp ethernet0/6.
session application type 0, name None, nas_id 0, timeout 60sec
service lookup identified service 0.
flow_first_final_check: in <ethernet0/5>, out <ethernet0/6>
existing vector list 1-4339cf0.
Session (id:8061) created for first pak 1 – session created for future packets in the session
flow_first_install_session======>
route to 1.1.70.250
arp entry found for 1.1.70.250 – firewall arps for where it is going to route packet to.
nsp2 wing prepared, ready
cache mac in the session
make_nsp_ready_no_resolve()
search route to (ethernet0/6, 1.1.70.250->10.1.1.5) in vr trust-vr for vsd-0/flag-3000/ifp-ethernet0/5
[ Dest] 12.route 10.1.1.5->0.0.0.0, to ethernet0/5
route to 10.1.1.5
flow got session.
flow session id 8061
post addr xlation: 10.1.1.5->1.1.70.250. – shows if there has been and address translation and how the packet looks when it is sent out.
Problem Indicators:
- Packet dropped, no route to host – no route has been round in the virtual router that the interface and zone is bound to that the packet arrived on. You need to look in your routing table to check to see if you have a route for the desitnaiton or source depending how you are routing.
- Packet dropped, denied by policy – If just before this you see a message saying searching global policy then it means that no policy has been matched so it has been dropped by default. You need to check your policy configuration.
- Policy match – Check the policy matach to make sure that it is matching the right polic and not doing allowed or denied by another rule
